
India’s data centre market is scaling fast, with capacity tripling to 1.5 GW since 2020 as AI, cloud, and digital demand push the sector towards a ₹2 lakh crore opportunity by 2030.
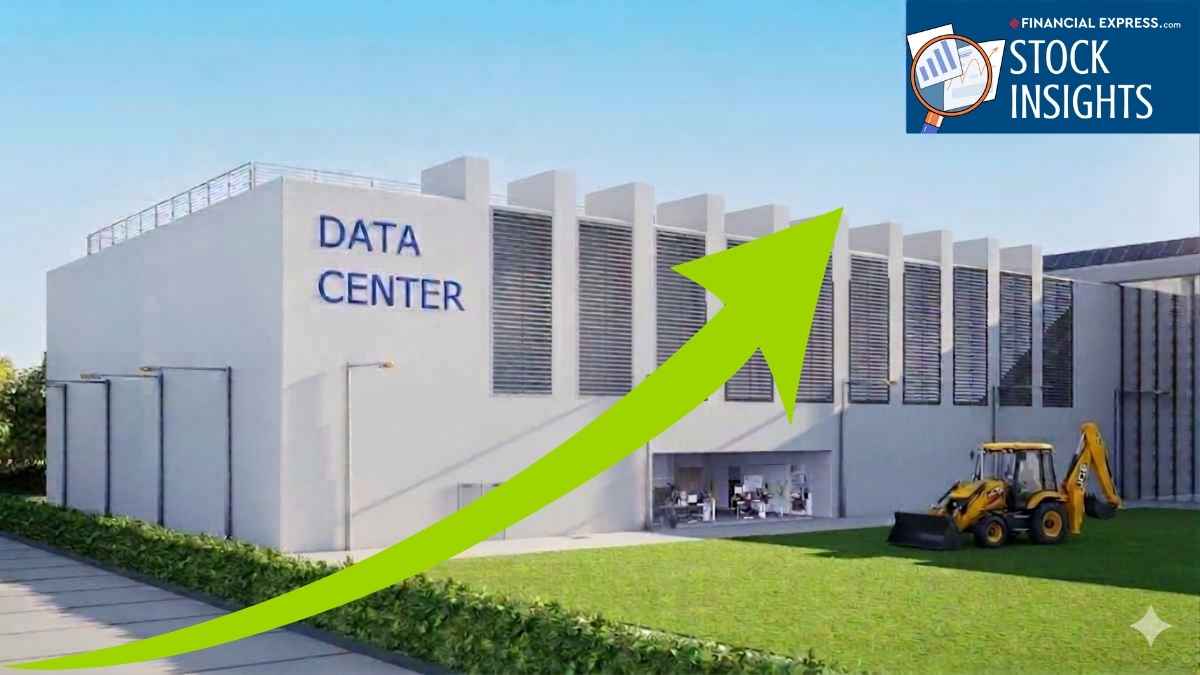
Data Center Installed Capacity Increased by 3X
According to the Government of India, installed data center capacity has increased 3X to around 1.5 gigawatt (GW) in 2025 from about 375 megawatt MW in 2020. Yet, despite generating nearly 20% of global data, India accounts for only about 3% of global data center capacity (as of September 2024), according to the National Association of Software and Service Companies.
This highlights a large supply gap and long runway for growth. Consequently, India’s data center market is projected to double to US$22 billion (around ₹2 lakh crore) by 2030, up from US$10 billion in 2025, according to property consultant Vestian. The capacity is projected to reach 6.5 GW by 2030, according to S&P Global.
The $67.5 billion Investment Commitment by Hyperscalers
Hyperscalers, including Amazon Web Services ($35 billion), Microsoft ($17.5 billion), and Google ($15 billion), could drive a significant portion of this investment, as they have pledged to invest approximately US$67.5 billion in India.
Most of this data center infrastructure remains concentrated in key metros, led by Mumbai, due to strong connectivity and infrastructure. Chennai acts as a global data gateway with multiple submarine cables, while Hyderabad, Bengaluru, and Pune are emerging as secondary hubs.
Against this backdrop, this article discusses two companies with expanding presence in data centers.
#1 Macrotech Developers: Scaling Palava for 10x Annuity Growth
Macrotech Developers (Lodha) is expanding into the data center sector, venturing beyond its core real estate business. The cornerstone of Lodha’s data center ambitions is a 400-acre land parcel in Palava, which is fully ready for construction.
This site is uniquely equipped to meet the power and connectivity requirements of modern data centers, offering an ultra-reliable power supply of 3 gigawatt (GW) drawn from both state and national grids. Additionally, the site currently features five optical fiber routes, with plans to expand this connectivity even further.
The Hybrid Land Framework: Front-Loading Gains and Realizing Yield
Lodha is utilizing a hybrid model to maximize both immediate cash flow and long-term recurring revenue. Of the total 400 acres, 300 will be sold directly to operators, while 100 will be retained to build Lodha’s own portfolio.
Lodha plans to continue selling land to major data center operators, with land values projected at approximately ₹70 crore per acre over the next few years. Past land transactions have already shown strong growth. A recent deal with ST Telemedia (STT) closed at around ₹21-23 crore per acre, representing an 8x increase in land value over just four years.
These land sales are expected to generate over ₹12,000 crore from FY27 onwards. Lodha will use these proceeds to largely self-fund the construction of 1 GW of Build-to-Suit (BTS) Powered Shells. This requires an estimated incremental cost of ₹10,000 crore.
Operational Arbitrage: How 90% Green Power Lowers Shell Operating Costs by 30%
Lodha’s data center park is highly competitive globally due to significant cost efficiencies and government backing. The project is approved under the Maharashtra Government’s Green Integrated Data Center Park policy. This provides Lodha with substantial fiscal incentives.
Lodha has signed two MOUs with the government to facilitate investments totaling ₹130,000 crore in the park. The capital expenditure for a turnkey shell in Palava is significantly lower, at around US$60 lakh per MW, compared with the global average of US$80–120 lakh per MW.
Specifically, management noted that constructing a power shell in Palava costs only about 30% of what it would cost in the US or Europe. Operational costs have been reduced by over 30%, largely because the facility uses 90% green power. This brings power costs down to US $0.06 per kWh.
Why Industry Giants Like Amazon and STT Are Anchoring Palava
The park has already gained traction, securing industry giants Amazon Web Services and STT, backed by Singapore’s Temasek, as anchor operators.
Lodha expects to announce its first set of advanced build-to-suit (BTS) box agreements within FY27. The company expects rental income from these data centers to begin flowing by FY29 (approximately two years after signing the agreements). However, this is still in its early stages, and therefore, its implementation will be closely monitored as a major risk.
The Non-DC Foundation: Commercial Scale Targets Through FY31
Ultimately, this data center strategy is a central pillar of Lodha’s broader goal to grow its annuity income by 10x over the next six years. This provides a stable, high-margin earnings base that will complement its traditional residential development cycles.
Lodha’s annuity business (RentCo division) is a core pillar of the company’s long-term strategy. In FY26, the company earned annuity income of approximately ₹290 crore, which constitutes a small fraction of its FY26 revenue of ₹16,676 crore. The annuity portfolio is diversified across three primary asset classes.
This includes retail and office spaces, warehousing, and industrial parks. In retail and office spaces, Lodha holds a total area of 370 lakh square feet, of which 43% is already completed, and 35% is leased. By FY31, Lodha estimates that the annual rental potential for its retail and office properties will reach ₹600 crore.
Lodha’s warehousing and industrial segment has seen steady growth. Spanning five locations, this segment totals 510 lakh square feet, with 43% completed. Lodha estimates this segment will yield an annual rental income of ₹400 crore by FY31. Overall, Lodha estimates ₹1,000 crore in rental income from these assets by FY31.
FY26 Financials: How Record Pre-Sales and High Margins Accelerated Deleveraging
Financially, Lodha delivered strong earnings in FY26. Lodha’s revenue grew 21% year-on-year to ₹16,676 crore. Net profit rose 24% to ₹3,431 crore. Adjusted EBITDA for FY26 stood at ₹5,650 crore, up 13.9% year-on-year. Robust financial metrics drove this growth. Pre-sales grew by 16% to reach an all-time high of ₹20,530 crore. Collections improved by 5%, reaching ₹15,160 crore.
The company continued its deleveraging strategy. The company’s net debt-to-equity ratio fell to a conservative 0.2x, well below their 0.5x threshold, and 3.5x at the time of their IPO.
Macrotech Share Price
#2 Anant Raj: The 357MW Sovereign Cloud Player
Anant Raj is a diversified Indian real estate and digital infrastructure developer. The company has two core verticals. The first is its traditional real estate and annuity business, paired with a rapidly expanding data center division. It provides comprehensive, end-to-end solutions ranging from colocation to cloud platforms.
Anant Raj’s Operational Base: Cloud Infrastructure as a Service Engine
Through Ashok Cloud, the company offers Infrastructure as a Service in partnership with Orange Business. Core services include compute, storage, network, and security; containerized services; OS management; migration assistance; and backup & disaster recovery. The business model depends on long-term client engagements, ensuring recurring income streams.
The company currently has an operational IT load capacity of 28 MW. This is divided between their Manesar facility (21 MW) and their Panchkula facility (7 MW). For FY26, revenue from data centers, infrastructure, and allied services stood at ₹176 crore. Segment revenue is expected to grow strongly as it executes its ambitious expansion roadmap.
The Aggressive 357 MW Roadmap: Scaling Data Center Infrastructure by FY32
Anant Raj has laid out an aggressive expansion plan to scale its data center capacity to 357 MW by FY32, with 117 MW expected to be in place by FY28. In FY27 alone, an incremental 35 MW of capacity at the Manesar and Rai locations is slated to go live with expanded cloud services. It is dedicating 25% of the 357 MW IT load capacity specifically to cloud services.
Decoding the Multi-City Expansion: Manesar, Rai, and the Andhra Pradesh Pivot
The planned 357 MW capacity is distributed across four key locations. In Manesar, the existing building is ready to handle up to 100 MW of IT load. Furthermore, there is an opportunity for a 50 MW greenfield expansion on adjacent vacant land. This will be executed in two phases with an estimated direct investment of ₹4,500 crore.
A 200 MW IT load data center is planned at Rai. In addition to the operational 7 MW, work has commenced on 20 MW at Panchkula. Total planned IT load capacity at Panchkula stands at 57 MW. The company also signed an MoU with the Andhra Pradesh government to set up a new 50 MW data center and IT park, expanding its footprint into South India.
Liquid-Cooled AI Partnerships and Sovereign Cloud Approvals
In addition, the company has entered into a strategic partnership with Submer, a Spain-based AI solutions provider. This partnership focuses on developing liquid-cooled, energy-efficient data centers specifically for sovereign and enterprise AI workloads at scale. A critical driver for Anant Raj’s future growth is its strong alignment with government and public-sector organizations.
Anant Raj Cloud has achieved empanelment with the Ministry of Electronics and Information Technology as a Sovereign Cloud Service Provider and with BSNL as a data center service provider. This enables the handling of mission-critical, compliance-compliant public-sector enterprise (PSU) deployments.
The company has forged strategic alliances with PSUs like RailTel to ensure reliability. Its infrastructure utilizes global technology partners, including VMware, Cisco, Palo Alto Networks, F5, and NetApp. Infrastructure components are sourced from leaders such as Schneider Electric, Mitsubishi Electric, and Johnson Controls.
FY26 Financials: How 28% Margins Fueled a Massive Debt Reduction
From a financial perspective, total revenue (including income from data centers) grew 22% year-on-year in FY26 to ₹2,512 crore. EBITDA rose 36% to ₹723 crore, while margins expanded by 271 bps to 28%. Net profit increased 31% to ₹557 crore. Alongside strong financial growth, it has deleveraged its balance sheet with net debt falling to ₹50 crore from ₹1,626 crore in FY21.
Anant Raj Share Price
Evaluating Capital Efficiency: Premium Valuations vs Historical Medians
Lodha stands out with strong Return on Capital Employed (ROCE) and Return on Equity (ROE), whereas Anant Raj has more moderate return ratios. Valuation-wise, both Anant Raj and Lodha trade at a premium relative to the industry and the 5-year historical median.
India’s data center opportunity is expanding rapidly, with capacity expected to rise to 6.5 GW by 2030, backed by investment from hyperscalers. Against this backdrop, both Lodha and Anant Raj are building long-term recurring revenue engines through data centers.
Though premium valuations mean execution, capacity ramp-up, and annuity monetisation will remain key monitorables for investors. Meanwhile, keep them in your watchlist.
Disclaimer:
Note: Throughout this article, we have relied on data from http://www.Screener.in and the company’s investor presentation. Only in cases where the data were unavailable have we used an alternative, widely accepted, and widely used source of information.
The purpose of this article is only to share interesting charts, data points, and thought-provoking opinions. It is NOT a recommendation. If you wish to consider an investment, you are strongly advised to consult your advisor. This article is strictly for educational purposes only.
About the Author: Madhvendra has been deeply immersed in the equity markets for over seven years, combining his passion for investing with his expertise in financial writing. With a knack for simplifying complex concepts, he enjoys sharing his honest perspectives on startups, listed Indian companies, and macroeconomic trends.
A dedicated reader and storyteller, Madhvendra thrives on uncovering insights that inspire his audience to deepen their understanding of the financial world.
Disclosure: The writer and his dependents do not hold the stocks discussed in this article.
The website managers, its employee(s), and contributors/writers/authors of articles have or may have an outstanding buy or sell position or holding in the securities, options on securities or other related investments of issuers and/or companies discussed therein. The articles’ content and data interpretation are solely the personal views of the contributors/ writers/authors. Investors must make their own investment decisions based on their specific objectives, resources, and only after consulting such independent advisors as may be necessary.